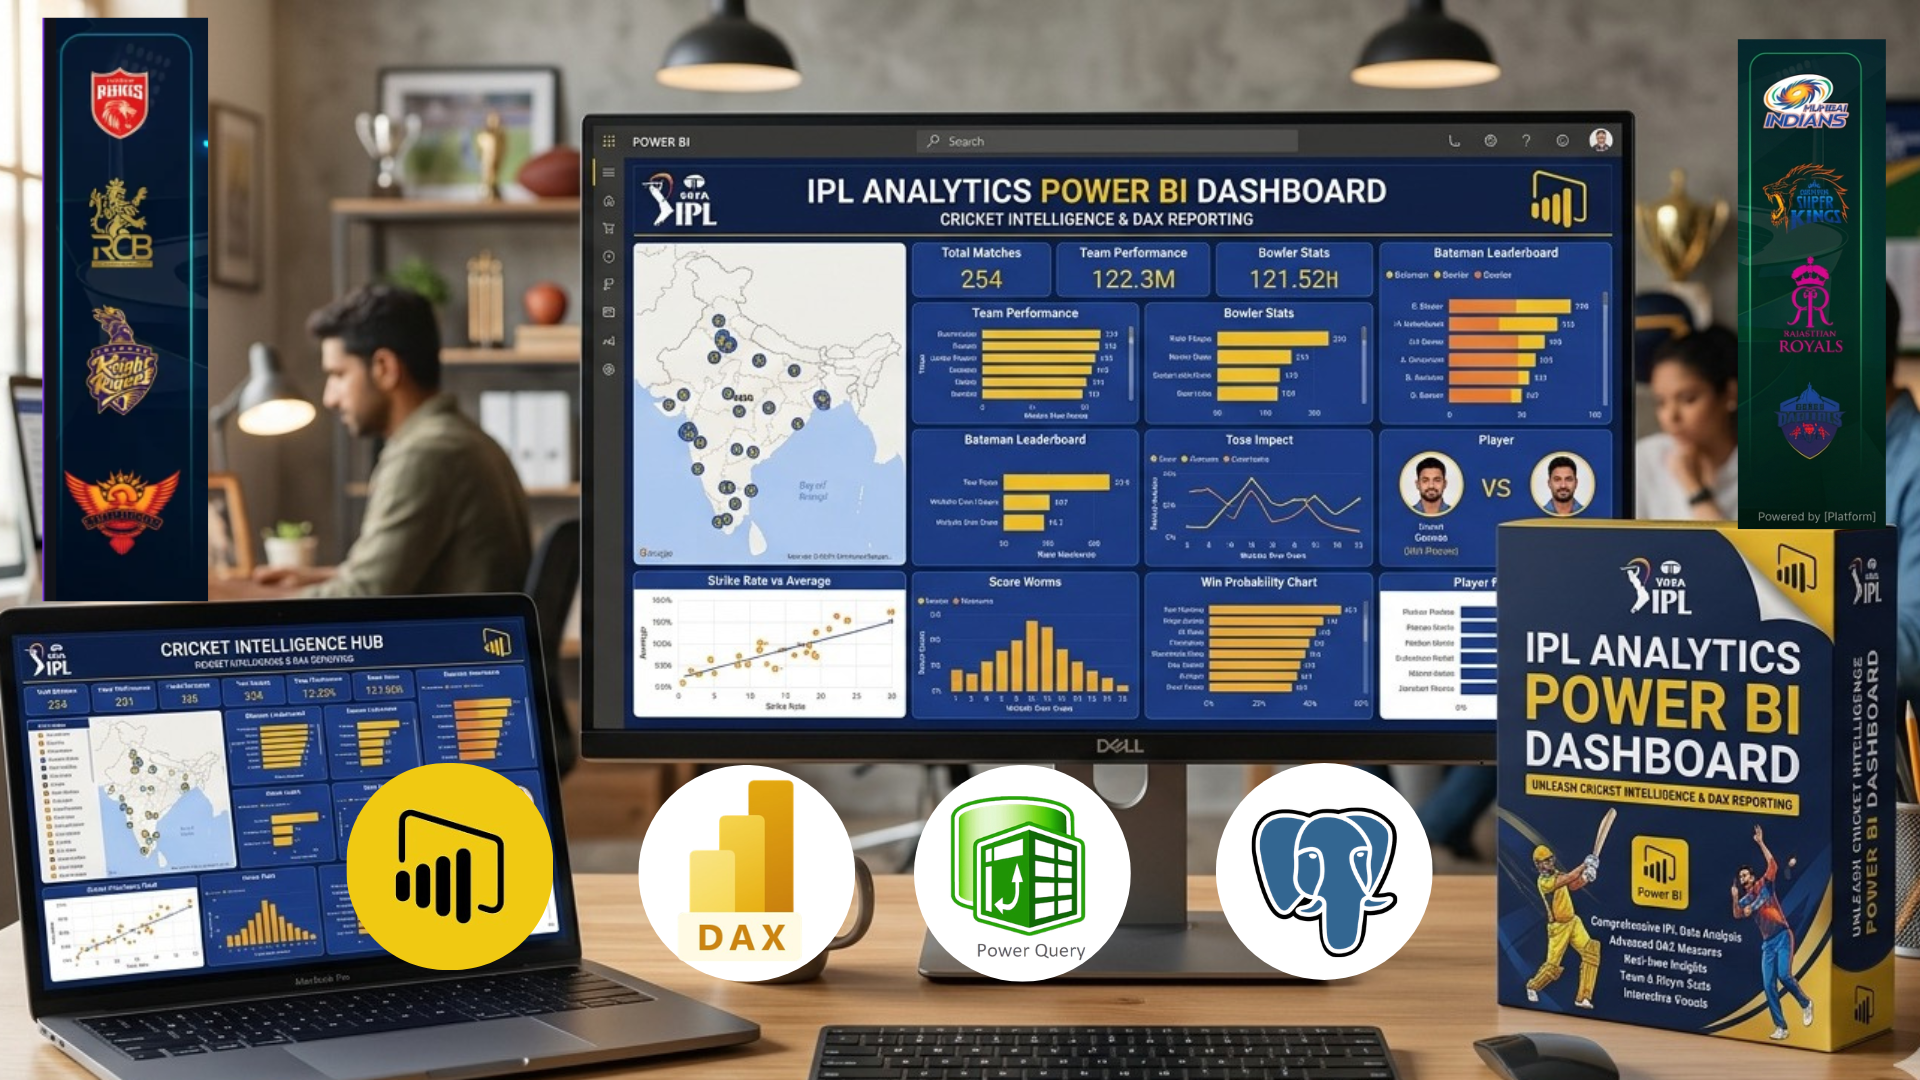
IPL Analytics Power BI Dashboard with Cricket Intelligence and DAX Reporting
Group: Capstone Project
|Product Category: BI Reporting & Analytics
|Sub Category: Power BI
About this Product
IPL Analytics Power BI Dashboard is an advanced Business Intelligence capstone project that connects directly to a normalized PostgreSQL database of 17 years of IPL ball-by-ball data (2008–2025) and transforms it into a production-grade, multi-page Power BI report — complete with a star schema data model, a comprehensive DAX measures library, and 13 interactive report pages.
With this project, you'll build a dashboard that can:
- Import 22+ dim/fact tables from PostgreSQL using a pre-configured .pbip definition package
- Build a semantic layer with relationships, calculated columns, and 20+ DAX measures
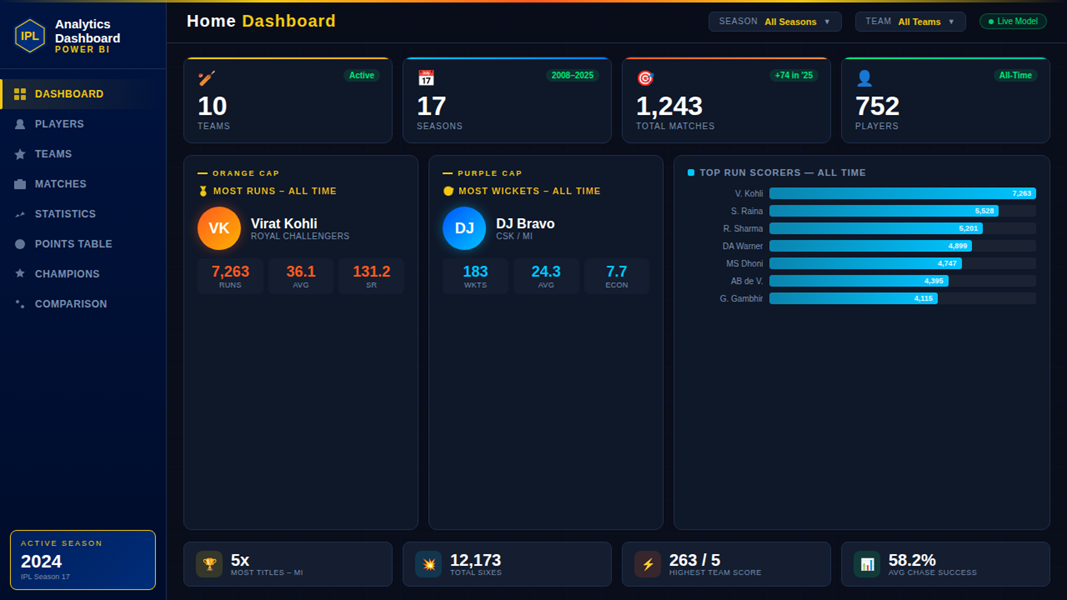
- Display KPI cards, Orange Cap and Purple Cap performers, and season-wise leaderboards
- Browse teams, players, and matches with drill-through pages for deep-dive analysis
- View points tables with qualification zone highlighting and NRR comparison bars
- Compare players and teams side-by-side using a dedicated comparison tool
- Publish reports to Power BI Service with Row-Level Security (RLS) for access control
This project teaches you practical skills like:
- Power BI data modeling — star/snowflake schema, relationships, and Import mode optimization
- DAX formula writing — KPI measures, time intelligence, TOPN, DIVIDE, and ALLSELECTED
- Report design — custom IPL theme, conditional formatting, bookmarks, and sync slicers
- Drill-through navigation, back buttons, and bookmark-powered toggle views
- Publishing to Power BI Service with scheduled refresh and RLS configuration
It uses Power BI Desktop, DAX, Power Query M, PostgreSQL, and a custom IPL JSON theme.
Why this project matters:
Power BI is the most in-demand BI tool in enterprise hiring. Building a multi-page report on real IPL data teaches you data modeling, DAX, and dashboard design — the exact three skills every BI and data analyst role tests for.
Resources

This is the sample image of Comprehensive team exploration dashboard showcasing IPL franchise profiles, season-wise performance, win/loss records, squad details, venue statistics, championship history, and comparative analytics. Includes interactive filters, team cards, charts, and detailed insights for analyzing individual franchise performance across seasons

Project Mentors
Similar Products


Product Performance Dataset
Topics: SQL, PostgreSQL, Retail Performance


Basic Professional Data Analysis
Topics: SQL, PostgreSQL, Data Quality Analysis


Restaurant Performance & Menu Optimization
Topics: SQL, PostgreSQL, Data Analytics


Similar Services
Finding the best experts for you...
No Services Yet
Expert services for this product will appear here once available.
Top User Reviews
Loading reviews...
Be the first to review this product!
Please try refreshing the page.